Yesterday I made the antenna a bit more weatherproof. Not quite happy with the outcome as the box didn’t fit the way I liked it. It is still a prototype, room for improvement. After a lot of tweaking with the Nanovna I settled with a nice SWR (or Return Loss if you wish, see pictures below).
Previous article of the antenna itself : click here.
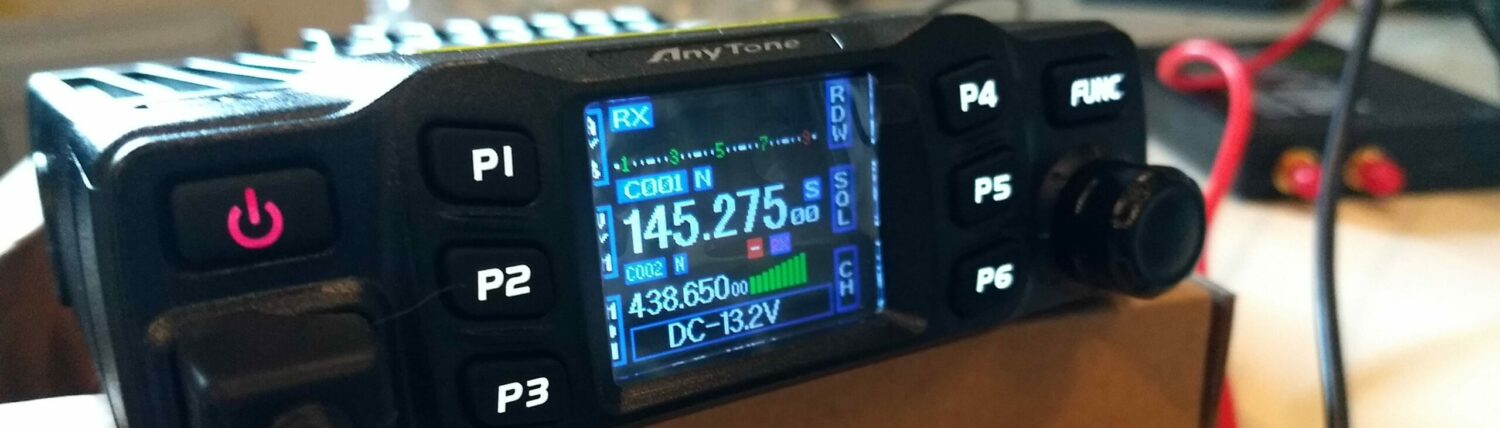
Attached the antenna to my balcony on the first floor, 3,5 meter or so above ground. Pulled a coax to the shack and was eager to see the result.
At this moment I have my Ubuntu laptop with Radiosonde_auto_rx connected to the Diamond X50 antenna on the roof. The testsetup with the antenna is my desktopcomputer, RTL v3 stick and RTL Power. Yep, no decoding, just receiving. But I used RTL Power to scan the band and log the values in a file. This morning I compiled the image of the values using Gopow after 12 hours of datalogging.
The command I used :
rtl_power -f 400M:406M:4000 -i 20 -c 25% -g 38 -e 12h data_sonde20200412.csv
So every 20 seconds the band will be scanned, Take 4 kHz wide chunks, Compress 25% , gain set to about 38 dB and this for 12 hours, write all the data in the CSV file.
The image is created with the standard commando :
gopow -i data_sonde20200412.csv
This creates a pretty large image, almost 5 MB in size. You can download the original image if you wish.
I can spot 3 radiosondes. Two are very obvious but the third one was a very faint signal. It was not recorded/decoded on my laptop, too weak I guess.
I took the original image and estimated the frequency to be 405.3 MHz. Every pixel is 2,6 kHz wide, I drew a vertical line and counted pixels (not really, took the measurement tool from Paint.net). The 405 MHz marker is at pixel 1920, the unknown sonde at 2036. Some math : 2036 – 1920 = 116 pixels.
Times 2.6 kHz = 301,6 kHz above 405 MHz, So 405.3 MHz confirmed.
Now the timing, did the same procedure.
The time marker 00:48:05 is at pixel 918, the signal starts at 968 = 50 pixels. Times 19 seconds = 950 seconds. Roughly 16 minutes. So start at 00:48 + 00:16 = 1h04 (23h04 UTC).
The second part, signal ends at pixel 1326, time marker 03:05:09 at 1291 = 35 pixels.
Times 19 seconds = 665 seconds or 11 minutes.
Ends in 03:05 – 00:11 = 2h54 (0h54 UTC).
I now have frequency, starttime and endtime at my location. The search can begin. I took the table from RadioSondy with the data from the last 48 hours. And took only those from 405.3 MHz and unknown frequencies.
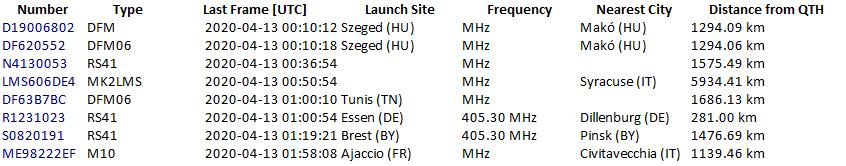
My best guess is that it is R1231023 launched in Essen (DE). Not bad for this small antenna, just a few meters above ground.
And finally the pictures and some links 🙂
- RadioSondy 48h data : https://radiosondy.info/sonde_table.php?table=last
- RTL Power manual : http://kmkeen.com/rtl-power/2014-07-27-08-09-20-103.html
- Download RTL Power (Windows) : https://ftp.osmocom.org/binaries/windows/rtl-sdr/
- Gopow : https://github.com/dhogborg/rtl-gopow
- Original bandscan image : Click here (right click to download)
